Get started
On this page
Instance Monitoring
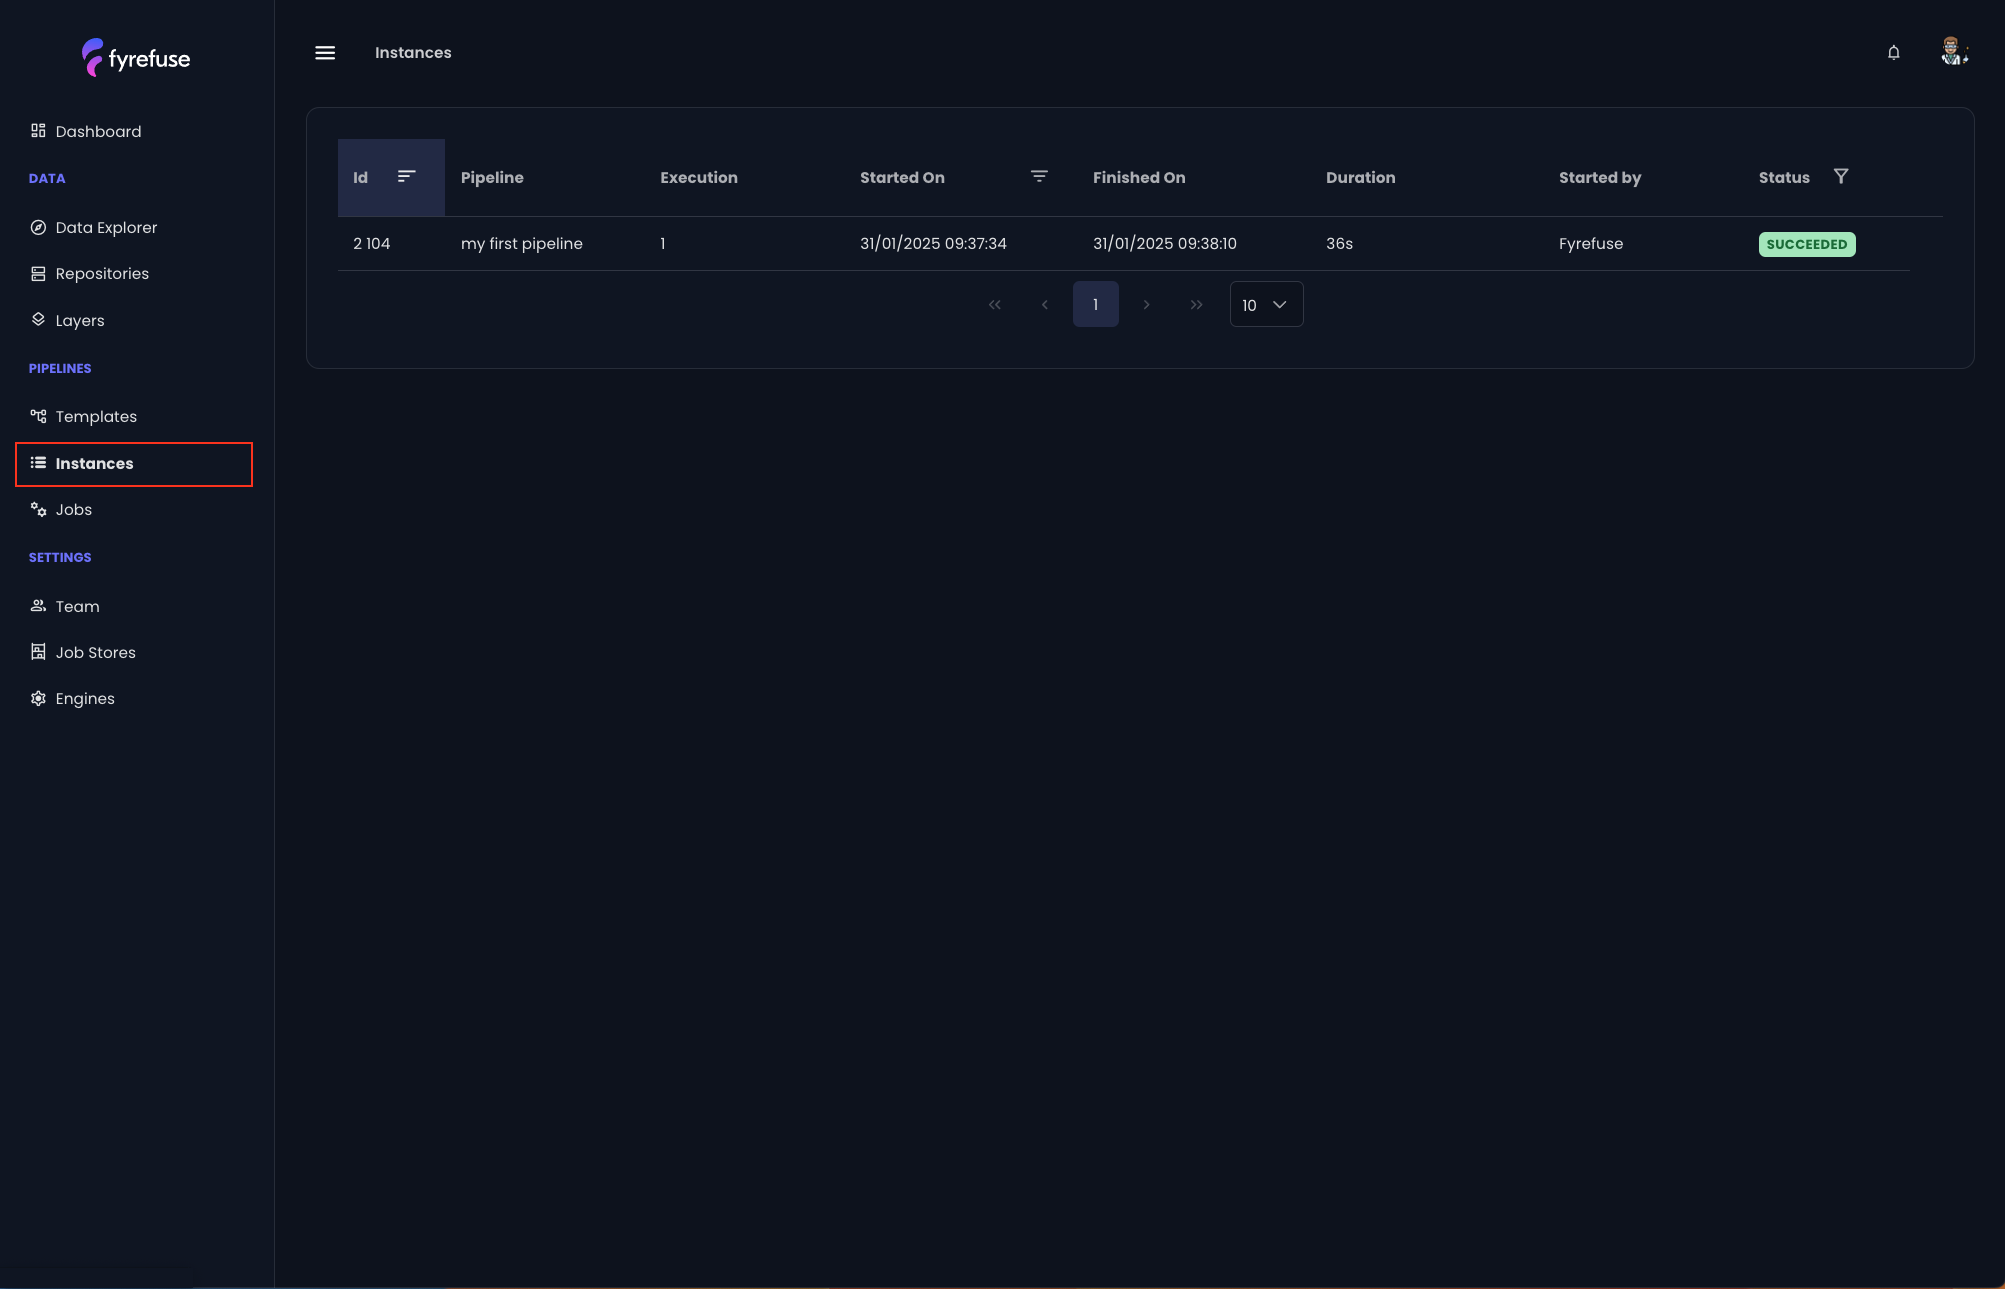
The Instances section is designed to help you keep track of the pipelines executions efficiently. In Fyrefuse, an “instance” represents a single execution of a pipeline through which it is possible to monitor its status, the execution metrics and logs, and general information such as the owner, the deployment timestamp and others.
Upon entering this section, you’ll see an overview of all instances with essential information, including:
- Instance id
- Pipeline Name: The specific pipeline to which the instance refers
- Execution: Progressive number to keep track of how many times the specific pipeline has been deployed
- Started/Finished On
- Duration: Difference is seconds between Finished On and Started On
- Started by: User that created the instance
- Status: The current state of the instance, which can be one of the following: Running, Succeeded, Stopped, Failed, or Scheduled
For more detailed information about a specific one just click on it.
Pipeline Diagram
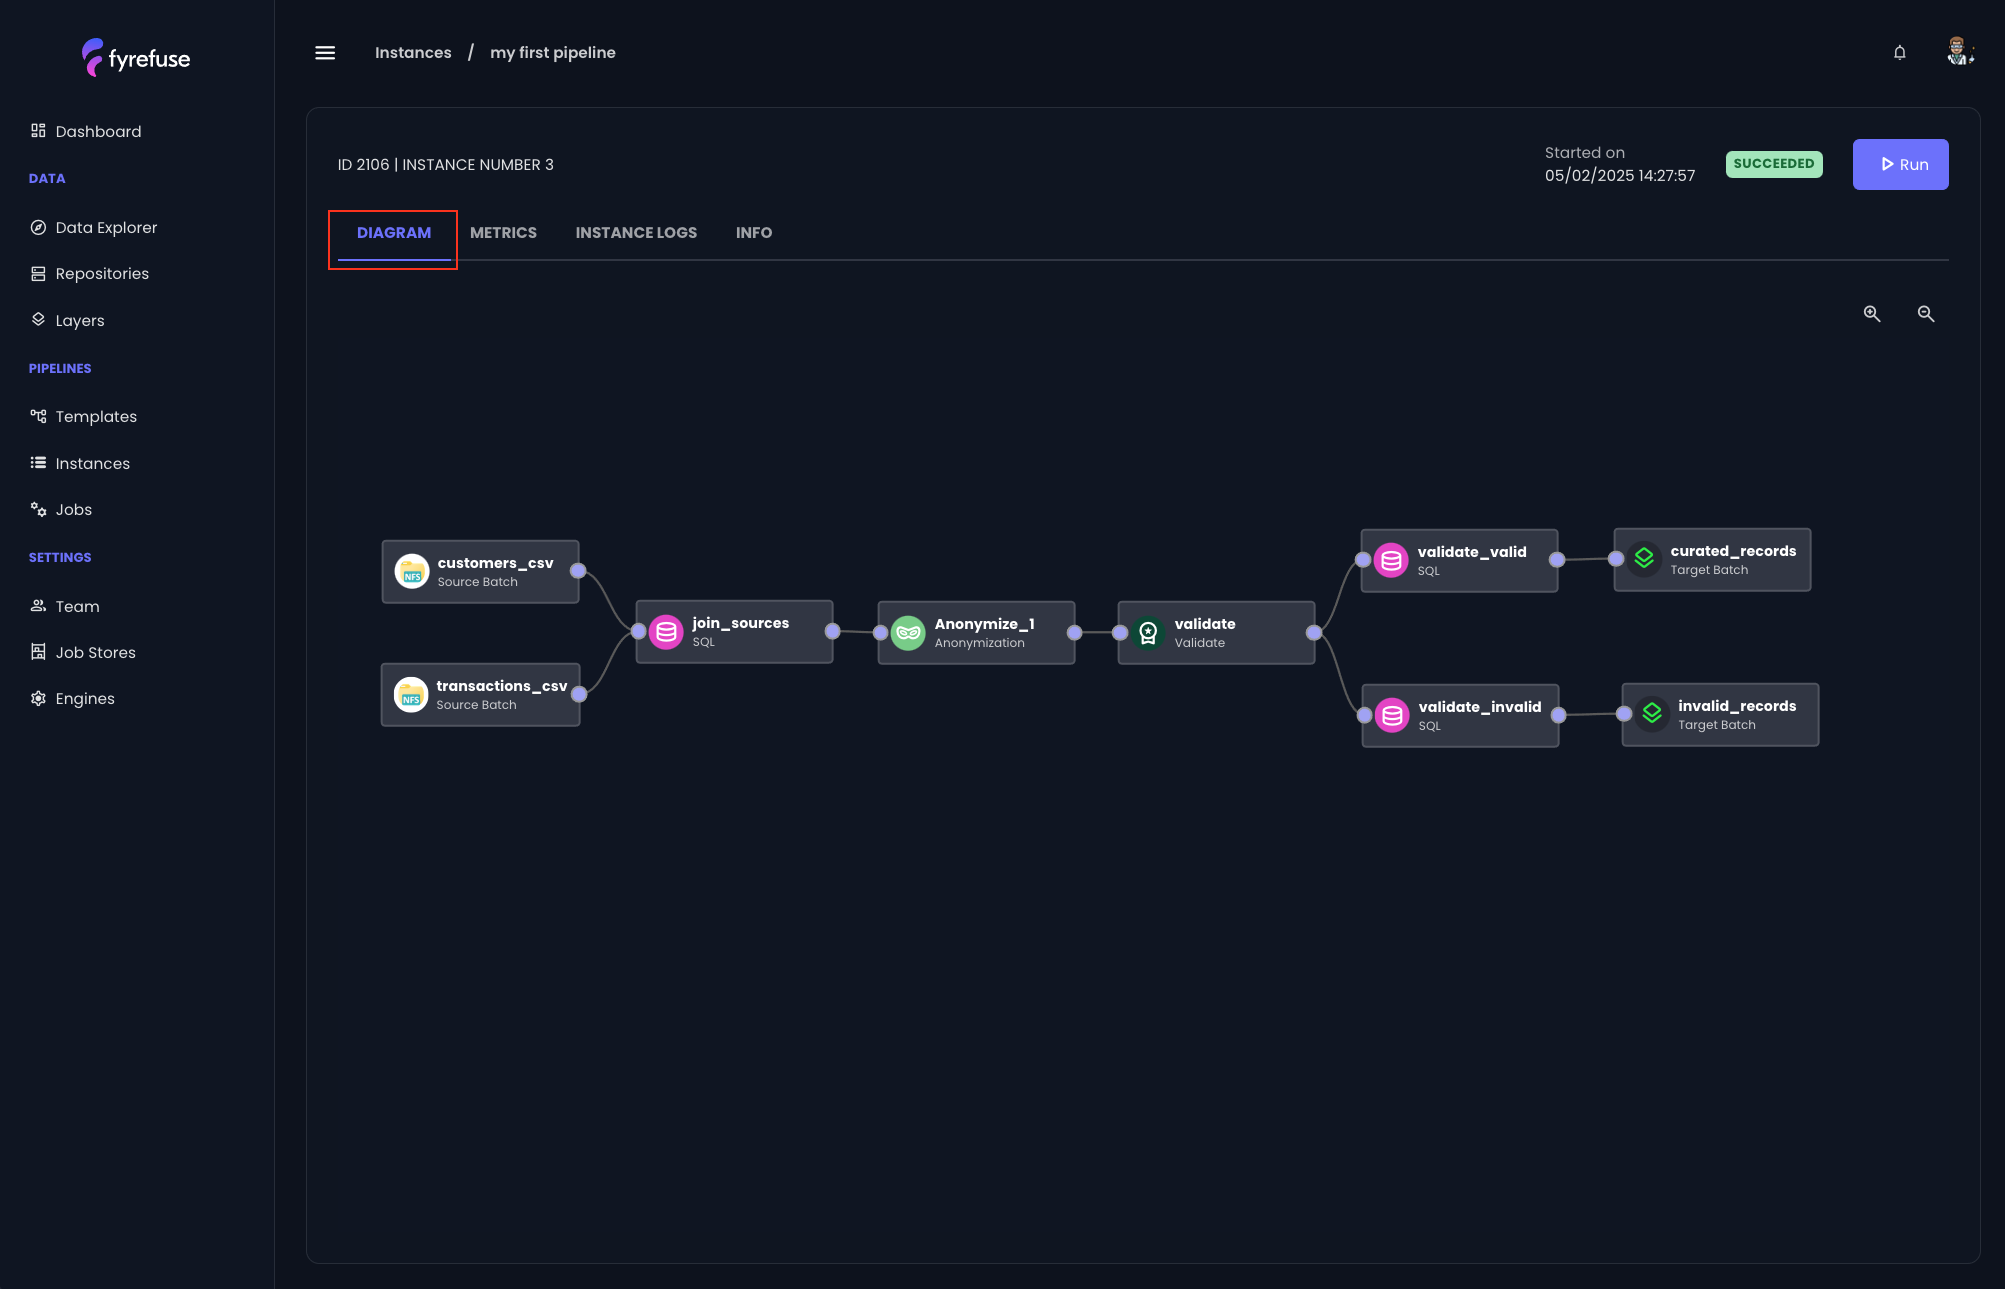
Let’s examine the first tab “Diagram”. Here you can find the graphical pipeline template the same way it has been designed in the pipeline editor.
Metrics
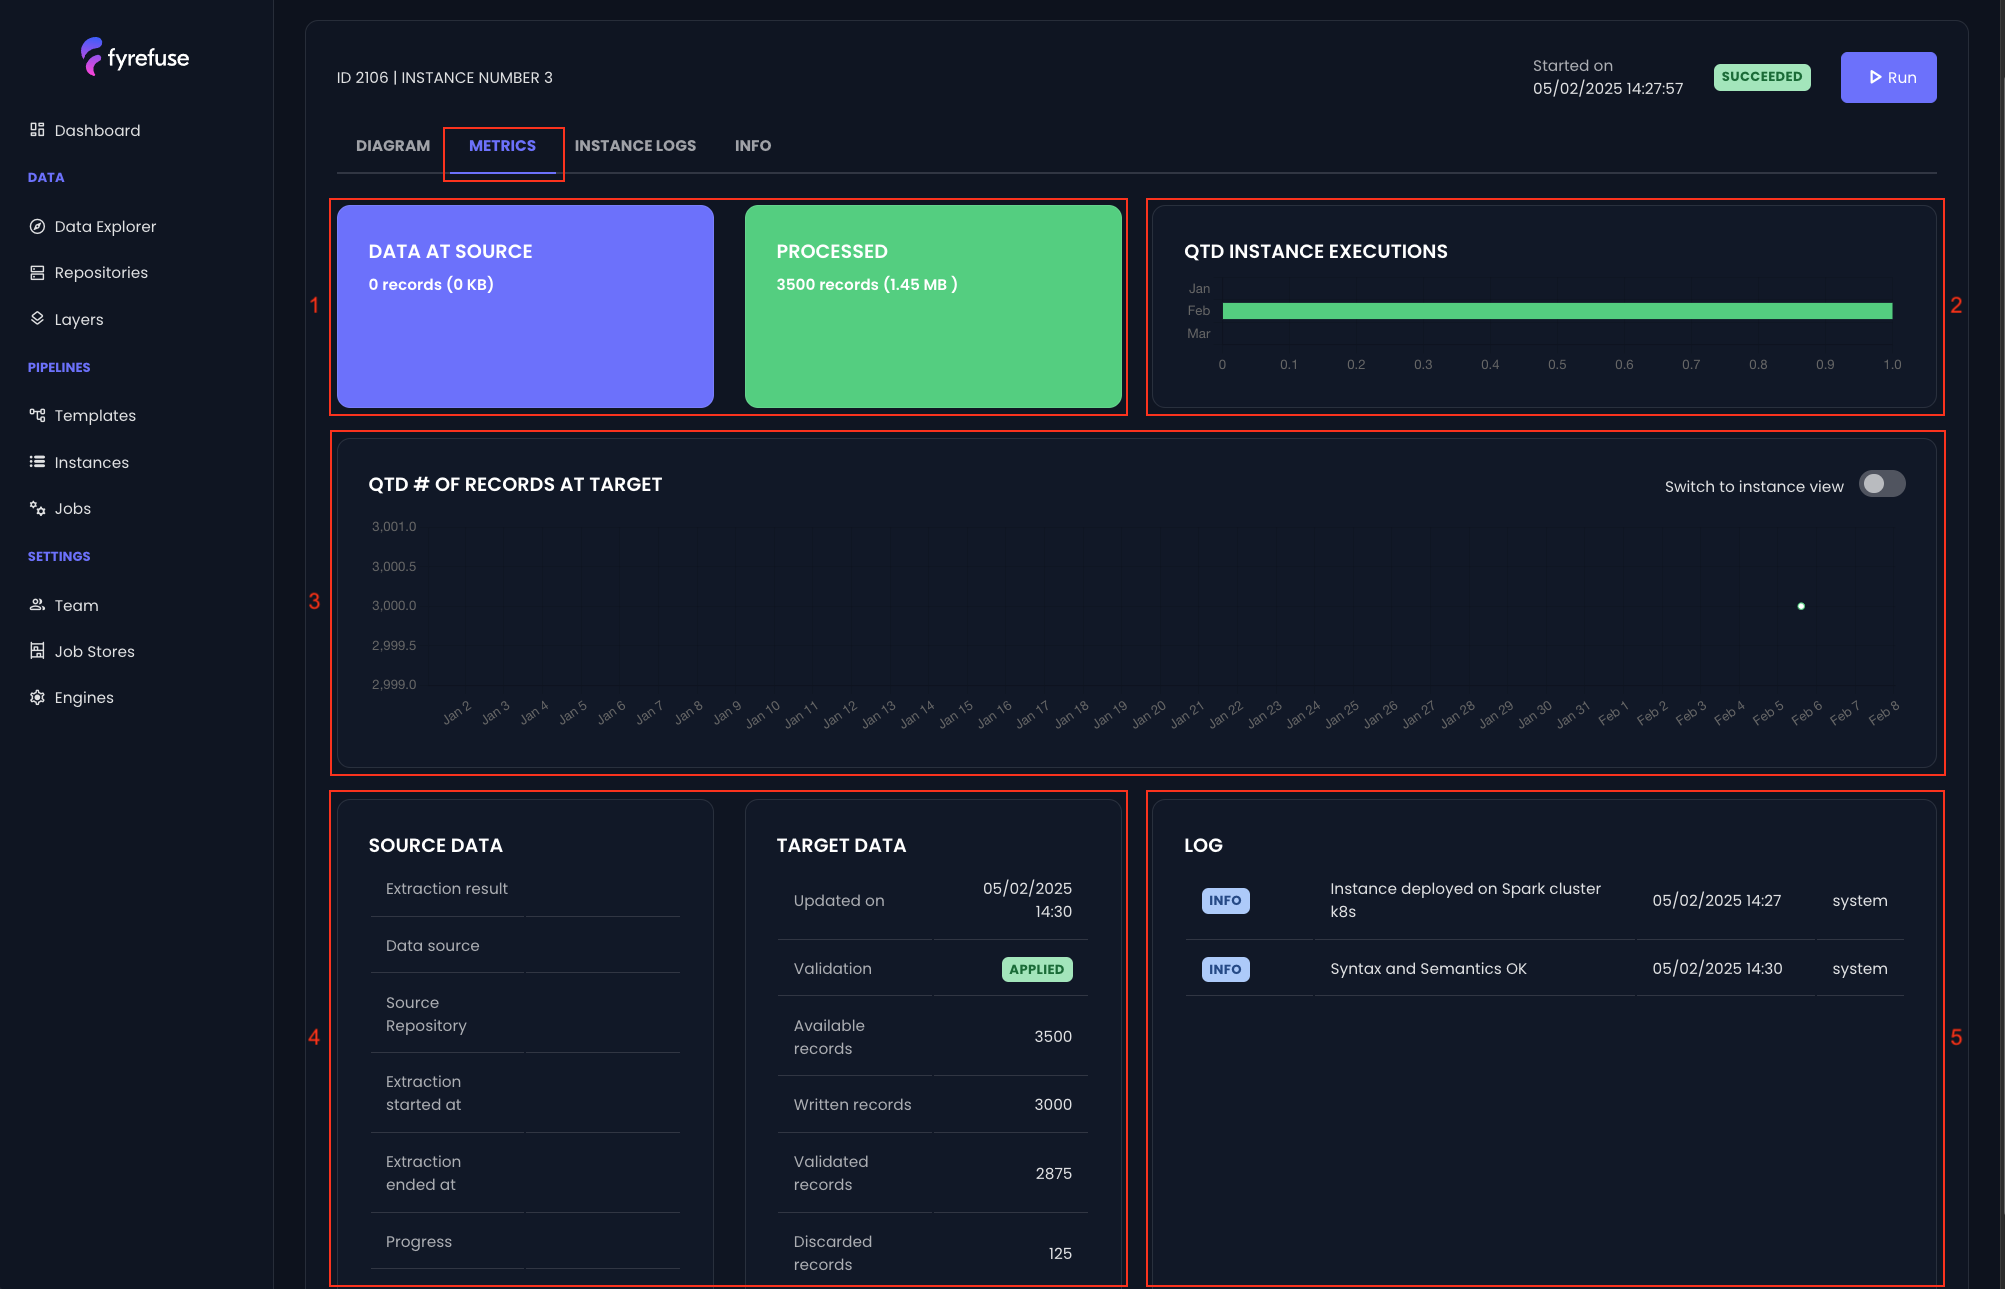
The next tab “Metrics” serves as a central dashboard, providing a comprehensive overview of the instance’s key performance metrics.
The visualization is logically divided into 5 widget groups:
- Overall data consumption
- Quarter To Date (QTD) Instance Executions
- QTD number of written records at target
- Deployment details
- Instance logs
The group (1) includes two cards.
- Data at source: Populated only when the instance is deployed via the Fyrefuse API by an external agent. It displays the expected number of records, if known, that the agent anticipates receiving from the sources.
- Processed: Updated at the end of the instance execution, showing the total number and size of the processed records.
The group (2) features a single widget.
Each horizontal line represents the monthly ratio of Succeeded (green) to Failed (red) instances for the given pipeline, providing a quick visual trend of execution success
The group (3) also contains one widget.
The y-axis represents the number of processed records.
The x-axis represents the days within the observation period (default: last 3 months).
Each instance is marked as a point, forming a trend line that illustrates the volume of processed records over time.
The group (4), similarly to the (1), consists of two cards.
- Source Data: Populated only when the instance is deployed via the Fyrefuse API. It provides key details about the instance deployment.
-
Target Data: Populated at the end of the execution, offering a detailed breakdown of processed records:
- Validation: Applied/Unapplied indicating whether a validation step was included in the pipeline
- Available records: Total number of records read from the sources
- Written records: Total number of processed records
- Validated records: Number of validated records (from validation step)
- Discarded records: Number of discarded records (from validation step)
The last group (5) contains the execution logs, each consisting of four key elements:
- Severity: INFO, WARN, ERR
- Message: Log details
- Timestamp: When the log entry was recorded
- User: The user associated with the log entry
Instance logs
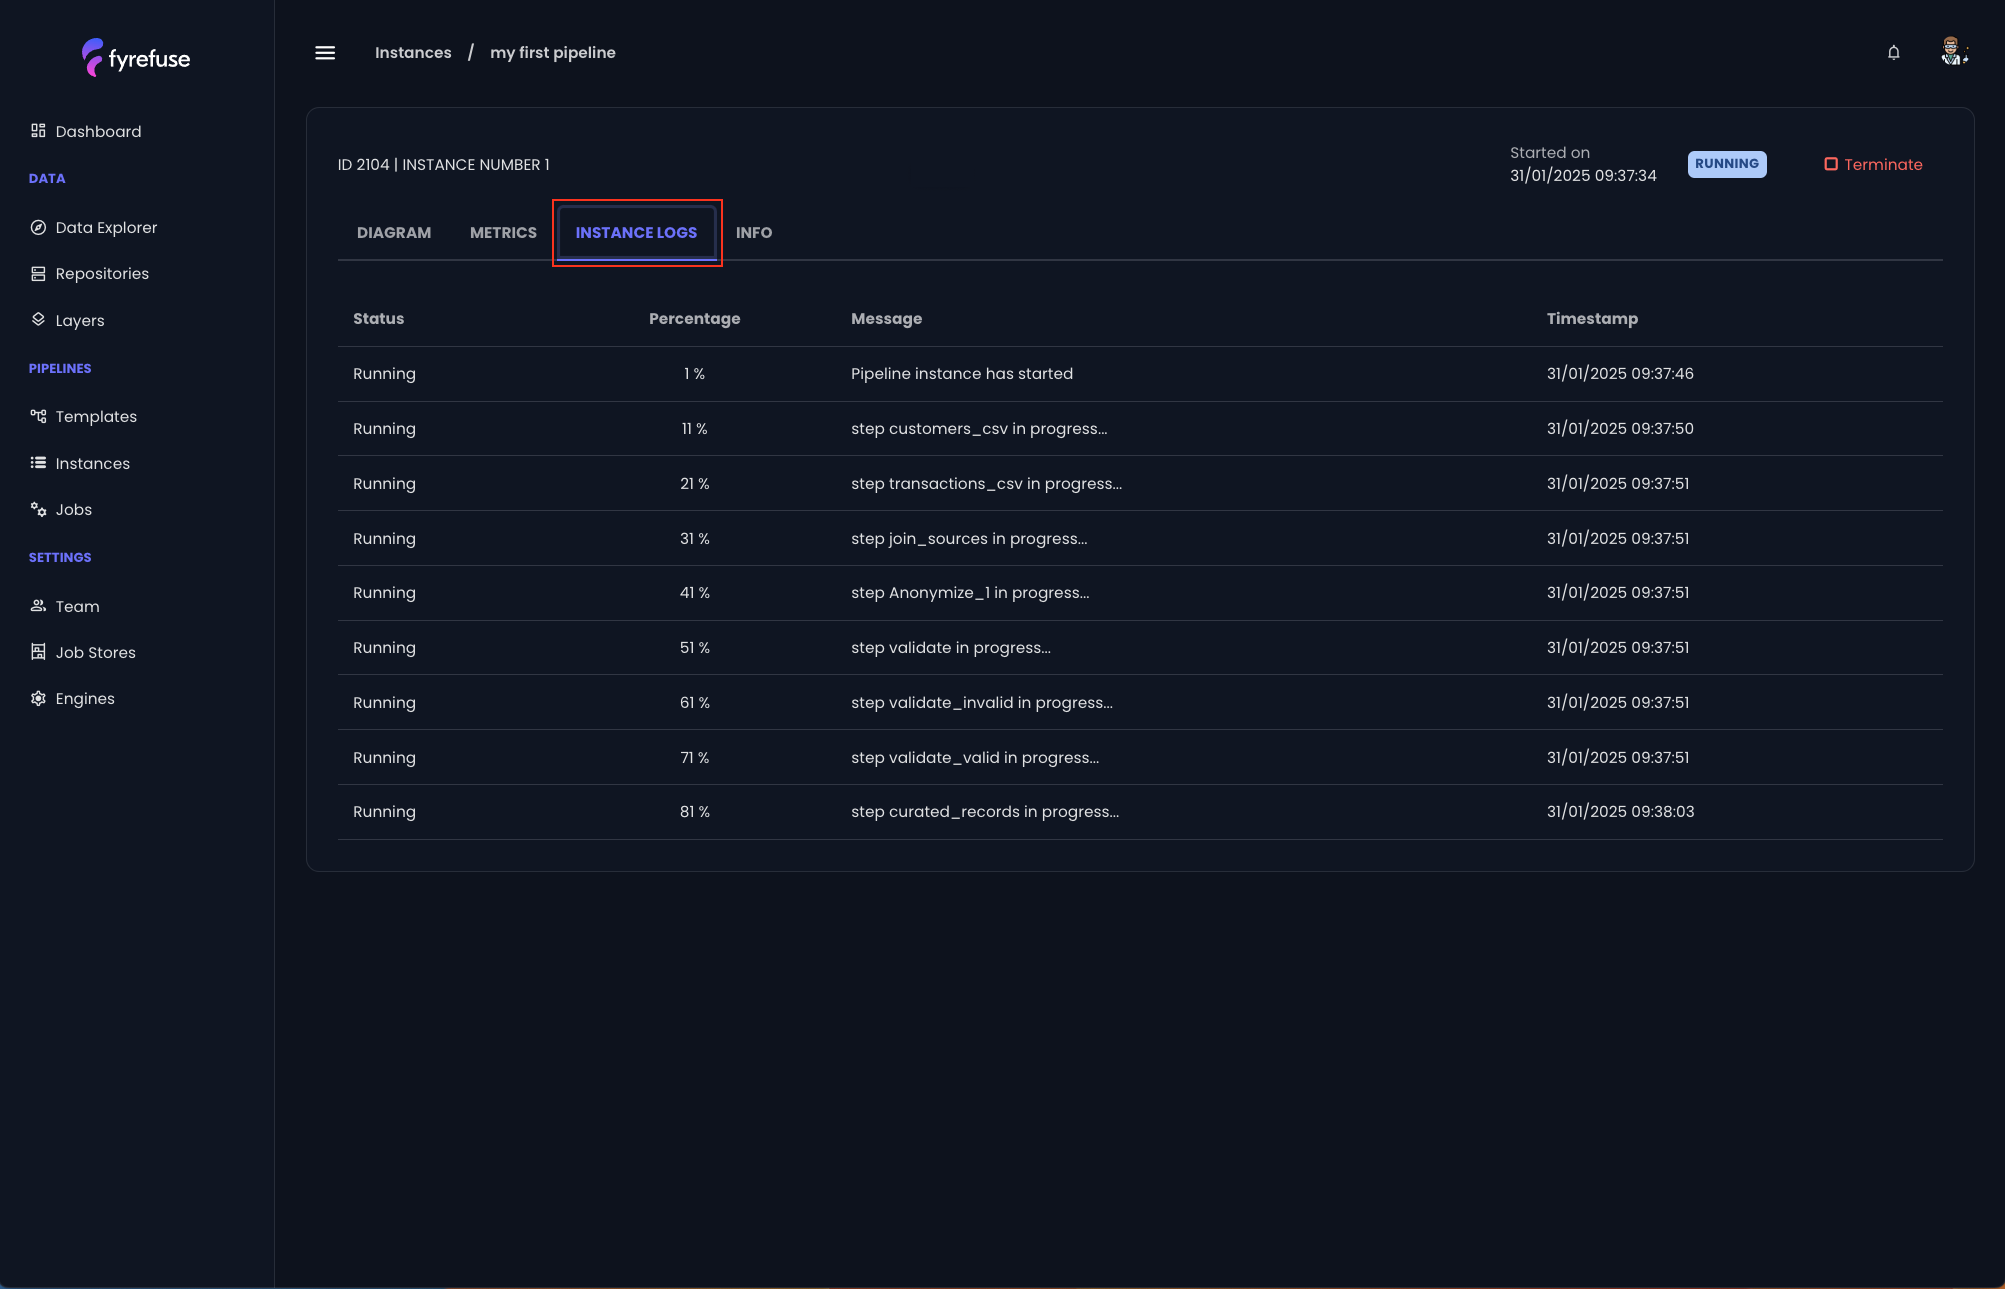
The third tab, "Instance Logs," shows the instance's progression with respect to the step that is currently running.
General Information
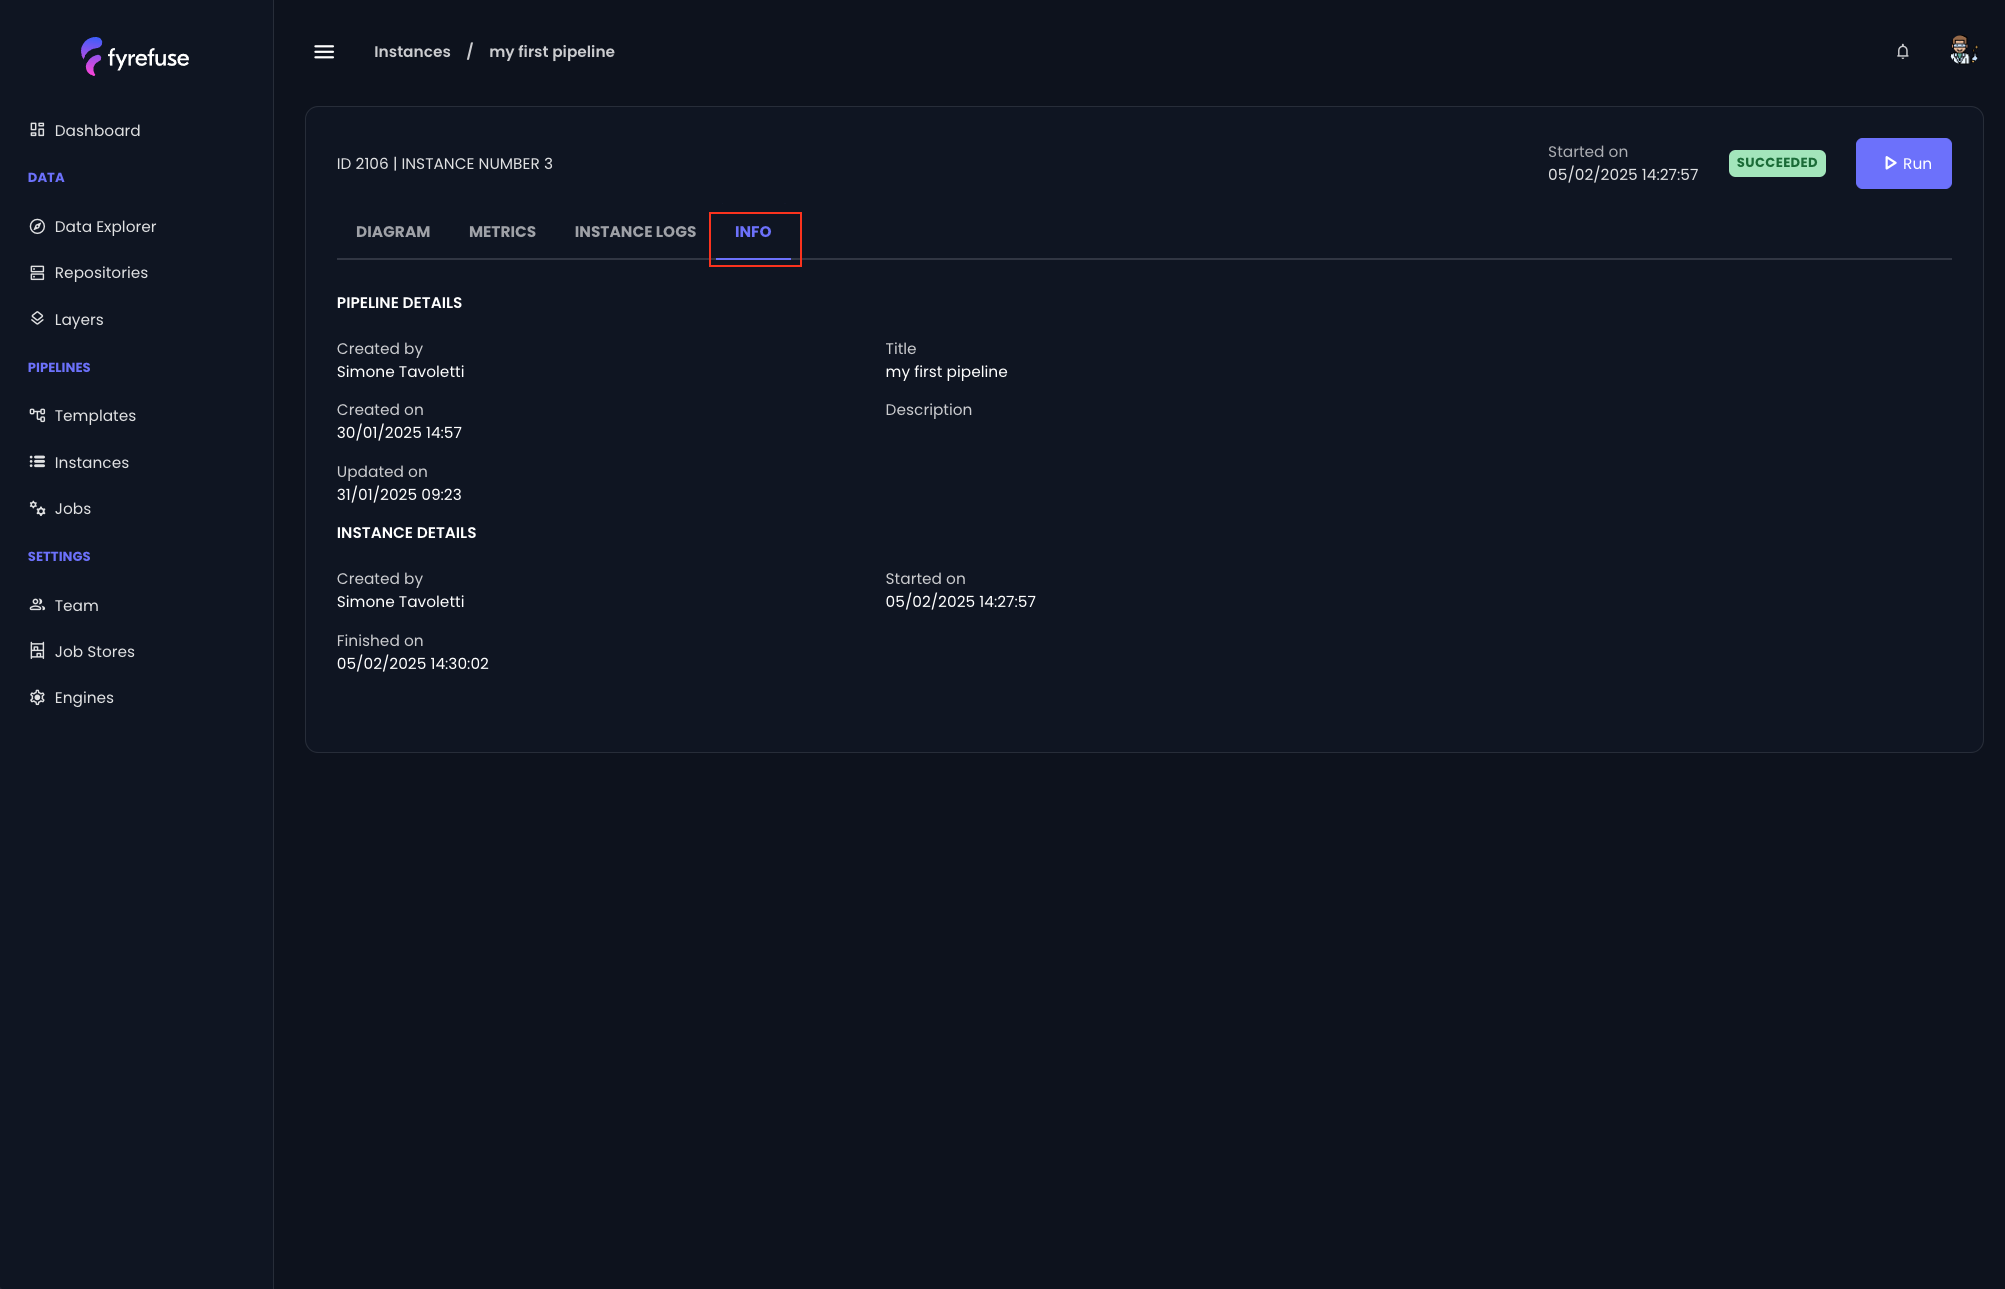
The last tab, "Info," provides a summary of the instance’s general details, including:
- Creation and last pipeline update timestamp
- Pipeline owner
- Instance owner
- Start and end instance timestamp
